Mike Kovach's RTA reference paper, RTA/ FFT comparrison

RTA Reference Data
Purpose
The purpose of this paper is to provide comparative acoustic measurements between SmaartLive, and the real time analysis (RTA) and auto-EQ functions of the DriveRack 260 (DR260) under various conditions. Data is collected to explore several issues through the measurements. These issues include the repeatability of the data, effects of microphone position, the effects of the room and a comparison to an FFT based analysis program. This data will be gathered through four measurements.
Multiple speakers are not considered since there are so many combinations of issues that could be measured. These include, on-axis, off-axis, centered, off center, with and without subs, different distances between subs/LF drivers, crossover slopes, etc. All of these issues become important and the combination is just too demanding of the number of measurements to get timely and valuable data.
The setup
In the interest of having a familiar set of working parameters, some very common and relatively inexpensive components were chosen for testing. The test data is taken with the following equipment.
The entire procedure takes place in a 3 car garage that is approximately 35’x16’x8 ½â€™. The garage doors were closed during the measurements. The division between the LF and HF driver on the speaker was approximately 5 feet from the concrete floor. The speaker was also approximately 8 feet (roughly equal between the two walls) from one wall and 12 feet (about 1/3 of the way into the space) from the other.
Pink noise is used as the measurement signal. That signal was generated by the device doing the measuring and was approximately 95 dB SPL, A weighted at the measurement microphone for each of the measurements.
All PEQ, compression, limiting and other features and functions were bypassed or set to very high thresholds as to not have an effect on the data. To allow for a minimum of 6dB crest factor for the pink noise and still have ample headroom, an input level at least 12dB below clipping into the DriveRack was used. Crossover filters were disabled so that the signal was, essentially, unaltered through the DR 260 except for the auto-EQ effects where appropriate for test data.
The Data
The results of the tests are shown here without discussion. The purpose is to simply present some information that can be used for further discussion by the group. Data is data. In no way was any data manipulation done to change the outcome. Every effort has been made to NOT make this a scientific study. It is, instead, a “close to real life� scenario that has quirks and anomalies. The expectations that some of us are mixing in “perfect spaces� is not assumed, likely or even possible. Bottom line-this is real life stuff.
Test 1. Repeatability of the DR 260 auto-EQ function
The purpose of this test is to determine how repeatable the DR 260 auto-EQ is. For this test, the concern is not with how accurate the data is. That is, whether the result actually produces a “flat� EQ for the speaker is not important. That premise will be tested in Test 2. This is a measurement of precision, or repeatability only. The question is “does the DR 260 auto-EQ create the same solution every time under identical conditions?�
With the measurement microphone approximately four feet from the speaker and directly between the HF and LF drivers in height, the DR 260 was set to auto-EQ the speaker. The parameters were high precision and a flat EQ curve, Response 0, as the target.
Below are the screen shots of three different trials of auto-EQ. The measurement microphone and speaker were not moved for each of the trials.
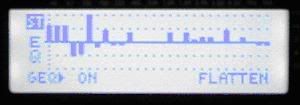
Figure 1.1. Results of first auto-EQ
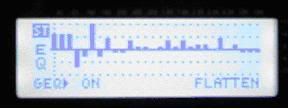
Figure 1.2. Results of second auto-EQ
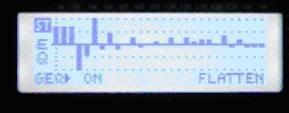
Figure 1.3. Results of third auto-EQ
Test 2. Direct on-axis frequency response measurement at close range (near field)
The first purpose of this measurement is to use various methods to establish a frequency response baseline of our speaker. Essentially, data is from four different views of the same speaker’s frequency response. Since the measurement is taken at a distance of 4 feet, the proximity will mitigate the effects of reflections from other surfaces in the room. The direct signal should be stronger than the first reflected signal by a considerable amount. All of these measurements are taken after the completion and application of the last auto-EQ from above.
This measurement also compares the information provided through three different measurement systems. The first (Figure 2.1) shows the screen from the RTA of the DR 260. Essentially, it is a 1/3 octave RTA using the reference level set when adjusting the gain control as the “zero� line for measurement.
Figure 2.1. On-axis, near field, frequency
response based on the screen in the DR 260 RTA
The second measurement system is the RTA provided with SmaartLive. There are two versions shown. The first (Figure 2.2) is the 1/3 octave screen for a direct comparison to the DR 260 RTA, the second (Figure 2.3) is a 1/24 octave screen to have a second point of comparison with RTAs in general. The third measurement system is the SmaartLive transfer function. While much more data is available through the SmaartLive program to determine the validity and problems associated with the data shown, this is a sample screen shot used for reference (Figure 2.4). The third function of this measurement is to examine the accuracy of the auto-EQ based on the results of running the auto-EQ function in Test1. The final screenshot, Figure 1.3, is the EQ applied to determine the readings in Test 2.
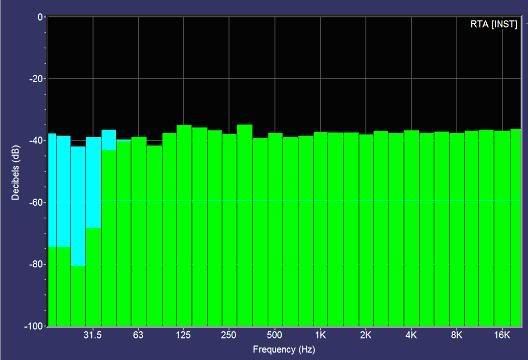
Figure 2.2. On-axis, near field, frequency response screen shot of SmaartLive’s 1/3
octave RTA
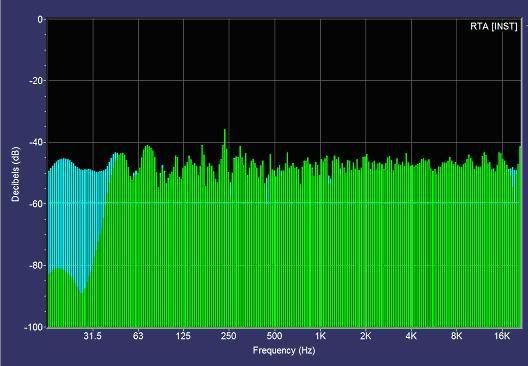
Figure 2.3. On-axis, near field, frequency response screen shot of SmaartLive’s 1/24
octave RTA
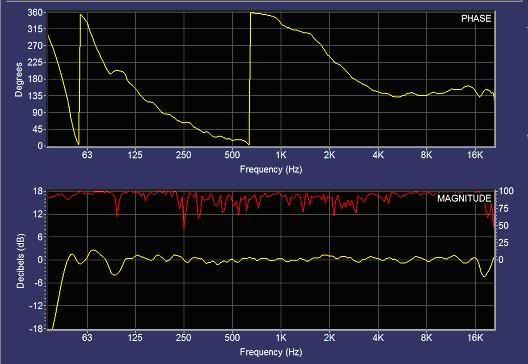
Figure 2.4. On-axis, near field, frequency response screen shot of SmaartLive’s
transfer function. Phase data and coherency is also indicated.
Test 3. Direct on-axis frequency response measurement at greater distance (far field)
This measurement is designed to reveal the effects of the room on the frequency response measurement. It is a direct comparison between the RTA in the DR 260 (Figure 3.1) and the transfer function from SmaartLive (Figure 3.2). Additional information in the SmaartLive screen is now available as a point for discussion. This measurement was taken 12 feet from the speaker and on-axis. The same auto-EQ curve is still applied to the speaker.
Figure 3.1. Results of the DR 260 RTA in the far field
room response.
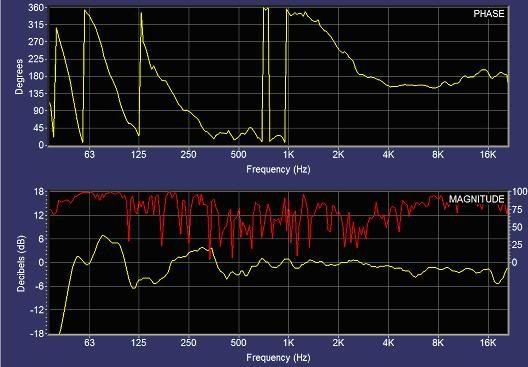
Figure 3.2. Screen shot of SmaartLive’s transfer function in the far field room response.
Note the addition of coherence data (red) in the frequency response box and the phase
data in the box above it.
As an additional reference (Figure 3.3), the impulse response from the SmaartLive measurement is also shown.
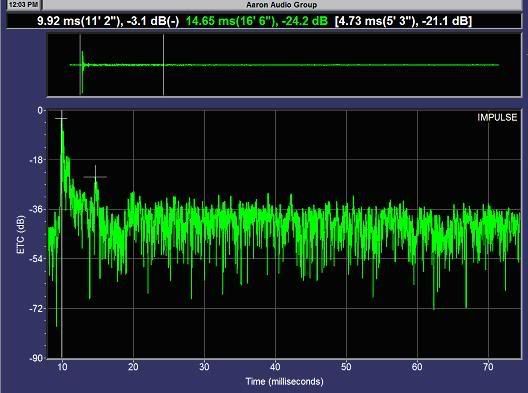
Figure 3.3. Impulse response from SmaartLive associated with data in Figure 3.2.
Test 4. Frequency response with measurement microphone on the floor
This simple measurement demonstrates the effect on frequency transfer to the microphone by moving the measurement microphone on the floor (Figure 4.1). There is approximately 12 feet between the speaker and the microphone. It is the same setup as Test 3, except for microphone placement.
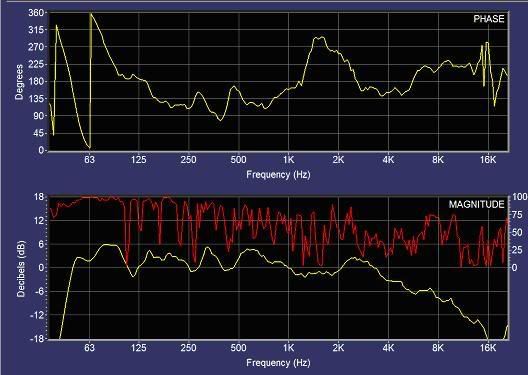
Figure 4.1. Smaart Live transfer function measurement of off-axis measurement
microphone on the floor
Purpose
The purpose of this paper is to provide comparative acoustic measurements between SmaartLive, and the real time analysis (RTA) and auto-EQ functions of the DriveRack 260 (DR260) under various conditions. Data is collected to explore several issues through the measurements. These issues include the repeatability of the data, effects of microphone position, the effects of the room and a comparison to an FFT based analysis program. This data will be gathered through four measurements.
-
1. Repeatability measurement of the DR 260 auto-EQ
2. Direct on axis speaker frequency response measurement in close range (near field)
3. Direct on axis speaker frequency response measurement at greater distance (far field)
4. Frequency response with the measurement microphone on the floor
Multiple speakers are not considered since there are so many combinations of issues that could be measured. These include, on-axis, off-axis, centered, off center, with and without subs, different distances between subs/LF drivers, crossover slopes, etc. All of these issues become important and the combination is just too demanding of the number of measurements to get timely and valuable data.
The setup
In the interest of having a familiar set of working parameters, some very common and relatively inexpensive components were chosen for testing. The test data is taken with the following equipment.
-
• Mackie SRM 450 speaker(s)
• Audix TR-40 reference microphone
• DriveRack 260
• Crest XR-20 Mixer
• Data collected by computer (Dell Inspiron 8200) through a Sound Devices USB Pre 1.5
• SmaartLive v.5.4
• All audio cable is Canare L-2T2S and hand terminated by me
The entire procedure takes place in a 3 car garage that is approximately 35’x16’x8 ½â€™. The garage doors were closed during the measurements. The division between the LF and HF driver on the speaker was approximately 5 feet from the concrete floor. The speaker was also approximately 8 feet (roughly equal between the two walls) from one wall and 12 feet (about 1/3 of the way into the space) from the other.
Pink noise is used as the measurement signal. That signal was generated by the device doing the measuring and was approximately 95 dB SPL, A weighted at the measurement microphone for each of the measurements.
All PEQ, compression, limiting and other features and functions were bypassed or set to very high thresholds as to not have an effect on the data. To allow for a minimum of 6dB crest factor for the pink noise and still have ample headroom, an input level at least 12dB below clipping into the DriveRack was used. Crossover filters were disabled so that the signal was, essentially, unaltered through the DR 260 except for the auto-EQ effects where appropriate for test data.
The Data
The results of the tests are shown here without discussion. The purpose is to simply present some information that can be used for further discussion by the group. Data is data. In no way was any data manipulation done to change the outcome. Every effort has been made to NOT make this a scientific study. It is, instead, a “close to real life� scenario that has quirks and anomalies. The expectations that some of us are mixing in “perfect spaces� is not assumed, likely or even possible. Bottom line-this is real life stuff.
Test 1. Repeatability of the DR 260 auto-EQ function
The purpose of this test is to determine how repeatable the DR 260 auto-EQ is. For this test, the concern is not with how accurate the data is. That is, whether the result actually produces a “flat� EQ for the speaker is not important. That premise will be tested in Test 2. This is a measurement of precision, or repeatability only. The question is “does the DR 260 auto-EQ create the same solution every time under identical conditions?�
With the measurement microphone approximately four feet from the speaker and directly between the HF and LF drivers in height, the DR 260 was set to auto-EQ the speaker. The parameters were high precision and a flat EQ curve, Response 0, as the target.
Below are the screen shots of three different trials of auto-EQ. The measurement microphone and speaker were not moved for each of the trials.
Figure 1.1. Results of first auto-EQ
Figure 1.2. Results of second auto-EQ
Figure 1.3. Results of third auto-EQ
Test 2. Direct on-axis frequency response measurement at close range (near field)
The first purpose of this measurement is to use various methods to establish a frequency response baseline of our speaker. Essentially, data is from four different views of the same speaker’s frequency response. Since the measurement is taken at a distance of 4 feet, the proximity will mitigate the effects of reflections from other surfaces in the room. The direct signal should be stronger than the first reflected signal by a considerable amount. All of these measurements are taken after the completion and application of the last auto-EQ from above.
This measurement also compares the information provided through three different measurement systems. The first (Figure 2.1) shows the screen from the RTA of the DR 260. Essentially, it is a 1/3 octave RTA using the reference level set when adjusting the gain control as the “zero� line for measurement.
Figure 2.1. On-axis, near field, frequency
response based on the screen in the DR 260 RTA
The second measurement system is the RTA provided with SmaartLive. There are two versions shown. The first (Figure 2.2) is the 1/3 octave screen for a direct comparison to the DR 260 RTA, the second (Figure 2.3) is a 1/24 octave screen to have a second point of comparison with RTAs in general. The third measurement system is the SmaartLive transfer function. While much more data is available through the SmaartLive program to determine the validity and problems associated with the data shown, this is a sample screen shot used for reference (Figure 2.4). The third function of this measurement is to examine the accuracy of the auto-EQ based on the results of running the auto-EQ function in Test1. The final screenshot, Figure 1.3, is the EQ applied to determine the readings in Test 2.
Figure 2.2. On-axis, near field, frequency response screen shot of SmaartLive’s 1/3
octave RTA
Figure 2.3. On-axis, near field, frequency response screen shot of SmaartLive’s 1/24
octave RTA
Figure 2.4. On-axis, near field, frequency response screen shot of SmaartLive’s
transfer function. Phase data and coherency is also indicated.
Test 3. Direct on-axis frequency response measurement at greater distance (far field)
This measurement is designed to reveal the effects of the room on the frequency response measurement. It is a direct comparison between the RTA in the DR 260 (Figure 3.1) and the transfer function from SmaartLive (Figure 3.2). Additional information in the SmaartLive screen is now available as a point for discussion. This measurement was taken 12 feet from the speaker and on-axis. The same auto-EQ curve is still applied to the speaker.
Figure 3.1. Results of the DR 260 RTA in the far field
room response.
Figure 3.2. Screen shot of SmaartLive’s transfer function in the far field room response.
Note the addition of coherence data (red) in the frequency response box and the phase
data in the box above it.
As an additional reference (Figure 3.3), the impulse response from the SmaartLive measurement is also shown.
Figure 3.3. Impulse response from SmaartLive associated with data in Figure 3.2.
Test 4. Frequency response with measurement microphone on the floor
This simple measurement demonstrates the effect on frequency transfer to the microphone by moving the measurement microphone on the floor (Figure 4.1). There is approximately 12 feet between the speaker and the microphone. It is the same setup as Test 3, except for microphone placement.
Figure 4.1. Smaart Live transfer function measurement of off-axis measurement
microphone on the floor
0